Sequence analysis
Here are links to a number of Windows software packages for sequencing or related applications requiring analysis of capillary electropherograms. They have been written by Ian Carr.
CpGviewer
CpGviewer is designed to speed up the characterisation of mammalian CpG islands by aligning DNA sequences from bisulphite-modified DNA to the genomic sequence of the CpG island. While simple in principle, this is a tedious error-prone task when done manually. CpGviewer web page
GeneScreen
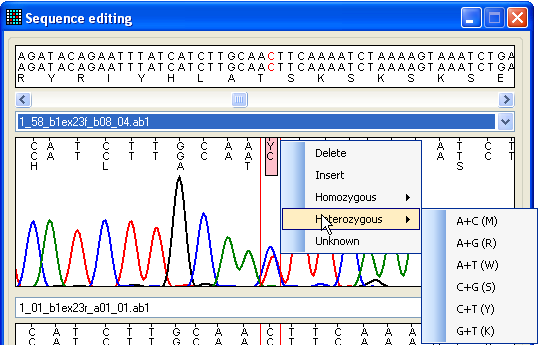
GeneScreen is designed for high-throughput detection and annotation of rare sequence variants. Although analysis of sequence electropherograms can be done by eye, this is very laborious and error-prone, especially when analysing large volumes of data. GeneScreen web page
HaplotypeViewer
HaplotypeViewer is designed to identify the haplotype of PCR products which contain a number of polymorphic positions, such as those that amplify the exons of the immunoglobin proteins. If a set of known alleles is imported, HaplotypeViewer will compare the genotype of each sample and attempt to identify which combination of alleles could be present in the sample and so deduce the samples haplotype. HaplotypeViewerweb page
Illuminator
Illuminator is a new sequence alignment program for the output from Illumina GA-II clonal sequencers. It is aimed primarily at kilobase-sized reference regions, as would typically be used in the context of mutation detection. Illuminator web page
MeltingCurves
MeltingCurves is an applications designed to analyse the melt curve data, from an Idaho Technology Lightscanner, to genotype DNA samples for known sequence variants. MeltingCurves web page
MethylViewer
MethylViewer was developed from CpGviewer such that the program can now analyse up to four different methylation sites such as CpG, GpC, CpNpG or any four user defined sites. If a non-native DNA methylase is used to modify chromatin-bound DNA, the methylation pattern can be used to identify the binding sites of DNA-binding proteins. MethylViewer web page
PeakHeights
PeakHeights is a powerful tool for measuring signal intensities of selected peaks within ABI electropherograms and exporting the data into spreadsheets for easy manipulation. Large batches of samples can be processed at once. PeakHeights web page
QSVanalyser
QSVanalyser calculates the relative levels of two sequence variants from sequence electropherogram files. The analysis is performed in batches, which can comprise more than 1000 trace files. A typical (and recommended) batch would comprise a single 96-well microtitre plate. The program exports its results to a spreadsheet file and an optional web page. QSVanalyser web page
